You have a spectrum from an unknown small molecule, a database has returned 250 possible structures, and you can afford to buy and test five as reference standards. Which five should you choose? And does a convincing-looking shortlist mean you have identified the molecule?
On one public benchmark, trained models put the known structure in their top five about six times in ten. Ranking by mass alone managed fewer than one in seven. That is useful progress, but the models were much less reliable at recognising when the correct structure was missing altogether. Study paper.
What the instrument tells you
An ion is an electrically charged molecule or fragment. In tandem mass spectrometry, abbreviated MS/MS, an instrument selects ions, breaks them apart and measures the resulting fragments. The spectrum records their mass-to-charge ratios and signal strengths. The pattern provides clues about the original molecule's structure. Detailed explanation.
The starting ion's mass helps narrow a database search. It cannot settle the answer: different structures can contain the same atoms and therefore have the same mass. The task is to use the fragment pattern to order those remaining possibilities. Here, a shortlist means the five candidates worth checking next, rather than five structures already established as correct. Study methods.
The benchmark supplied 10,648 test spectra from 1,421 molecules. After repeated structures were removed, a candidate list typically contained about 252 structures, and every list contained the known answer. That last condition matters: the benchmark asks how well a method ranks an available answer, before asking whether a real database contains it. Data and candidate lists.
Six useful shortlists in ten
The main measure was Recall@5: how often did the known structure appear somewhere among the first five candidates? A score of 60% means success for about 60 of every 100 spectra under these test conditions. It does not mean the first candidate has a 60% chance of being correct.
The strongest methods here were alignment models. During training, they learned to give a spectrum and its matching structure similar numerical representations. At ranking time, a candidate received a higher score when its representation resembled the spectrum's. Emb-Cos and DreaMS + Morgan are two versions of this approach. Methods.
| Method | Known structure in the top five |
|---|---|
| Emb-Cos alignment model | 63.2% |
| DreaMS + Morgan alignment model | 61.4% |
| DeepSets, which predicts molecular features from the spectrum | 31.3% |
| Precursor mass-error ranking | 13.3% |
| Random ordering | 2.1% |
Results for the benchmark's lists with repeated structures removed. Recorded metrics.
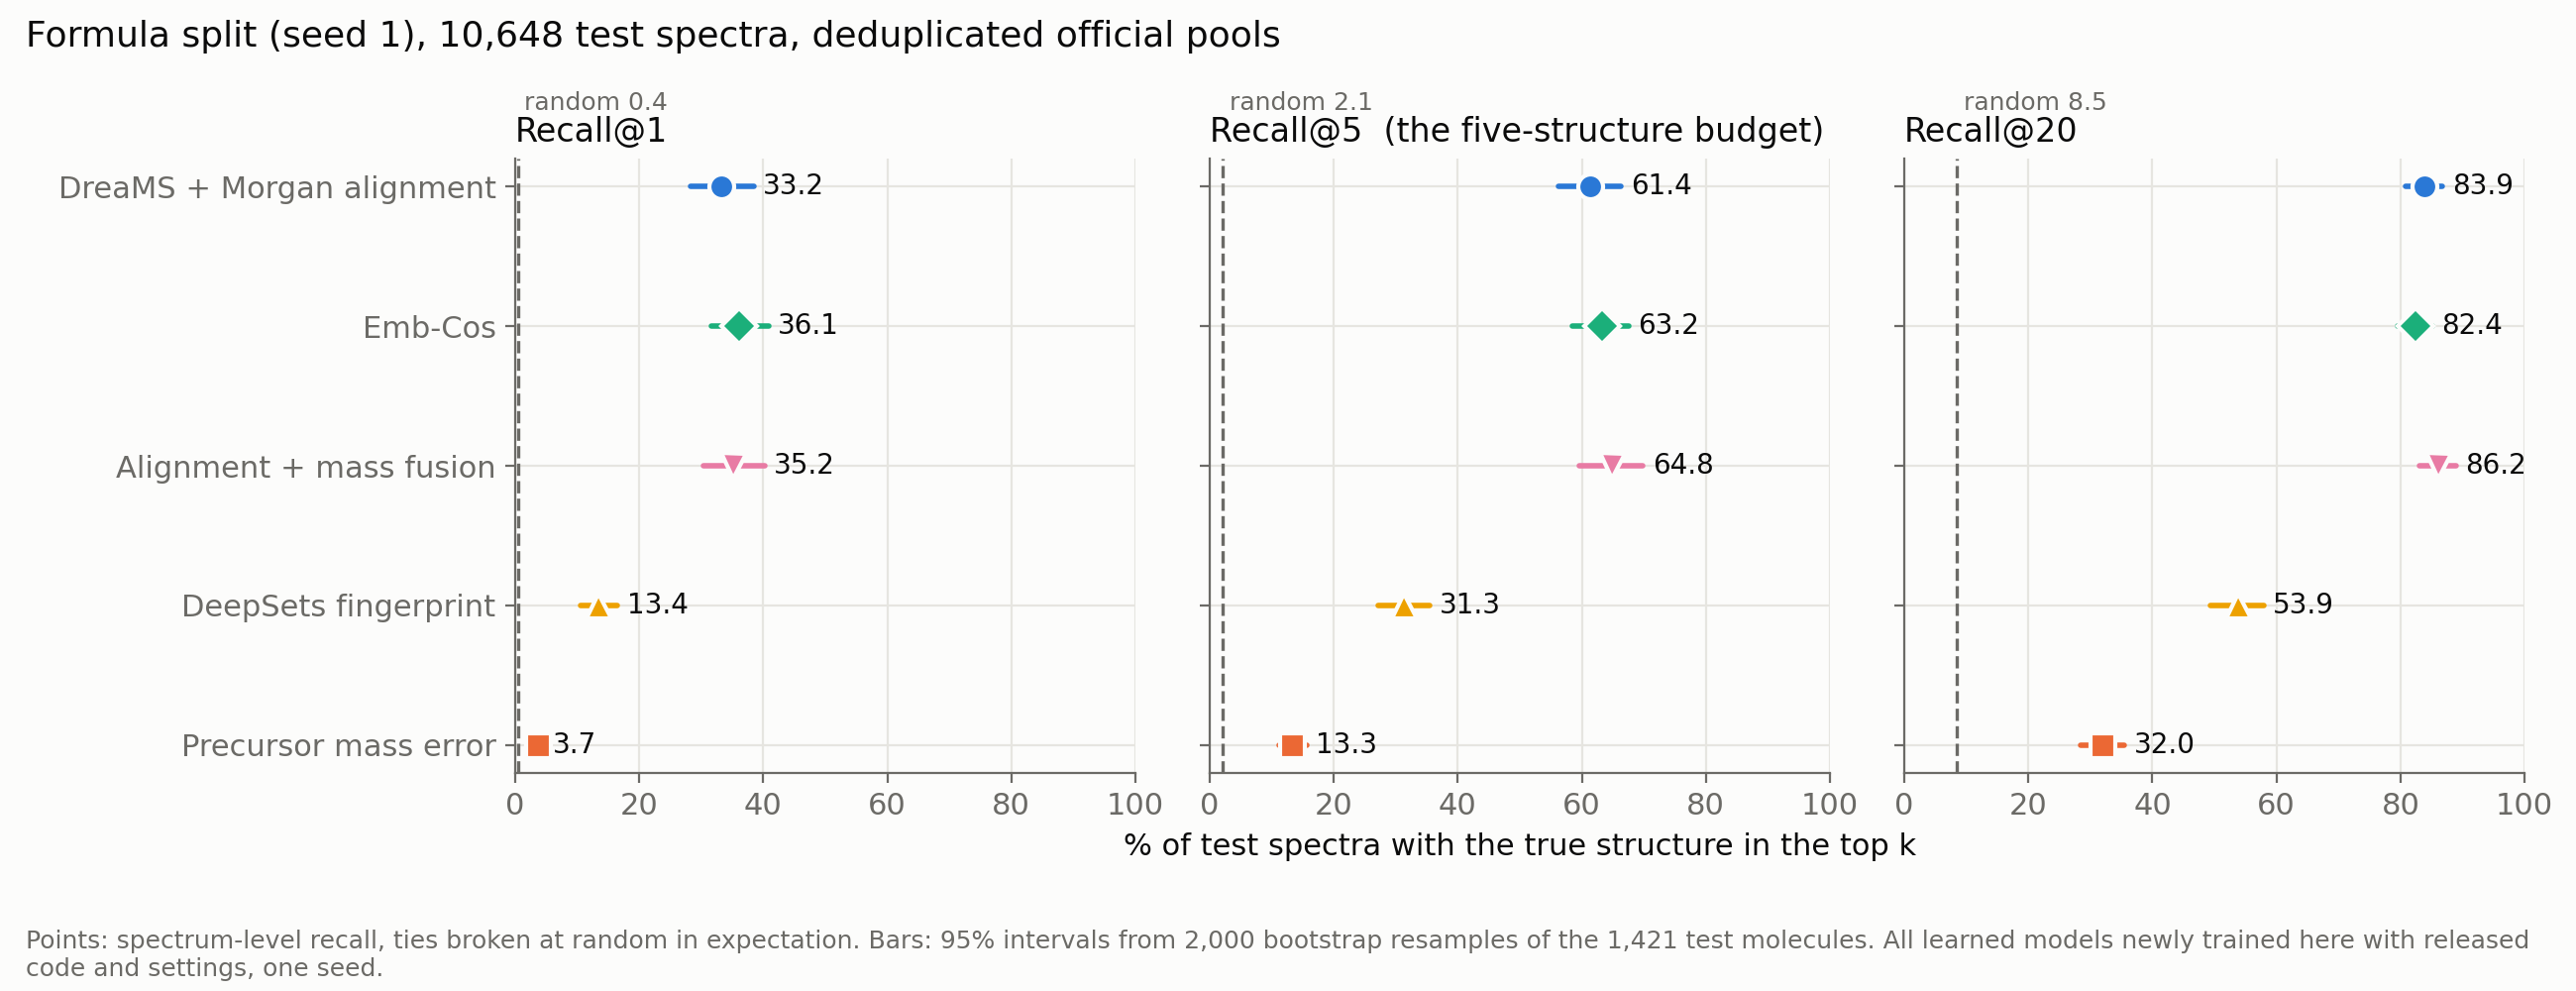
Read the middle panel for a five-candidate budget. The bars show uncertainty from resampling test molecules. The combined alignment-and-mass method is exploratory. Figure evidence.
The two alignment models were not clearly separated. Their estimated difference was small, and its uncertainty interval included zero. That leaves their relative performance inconclusive; it does not establish that they are equivalent. Both were substantially ahead of mass-error ranking in this comparison. Paired comparisons.
More candidates compete for the same five places
A headline hit rate is incomplete without the list size. The study repeated ranking on smaller lists and on expanded lists containing additional plausible structures, while keeping the correct answer present.
For DreaMS + Morgan, Recall@5 was 94.5% with 16 candidates, 61.4% with a median of 252, and 41.3% with a median of 449. A much longer database list therefore changes the task. The benchmark's six-in-ten result should not be treated as a fixed property of the model. List-size results.
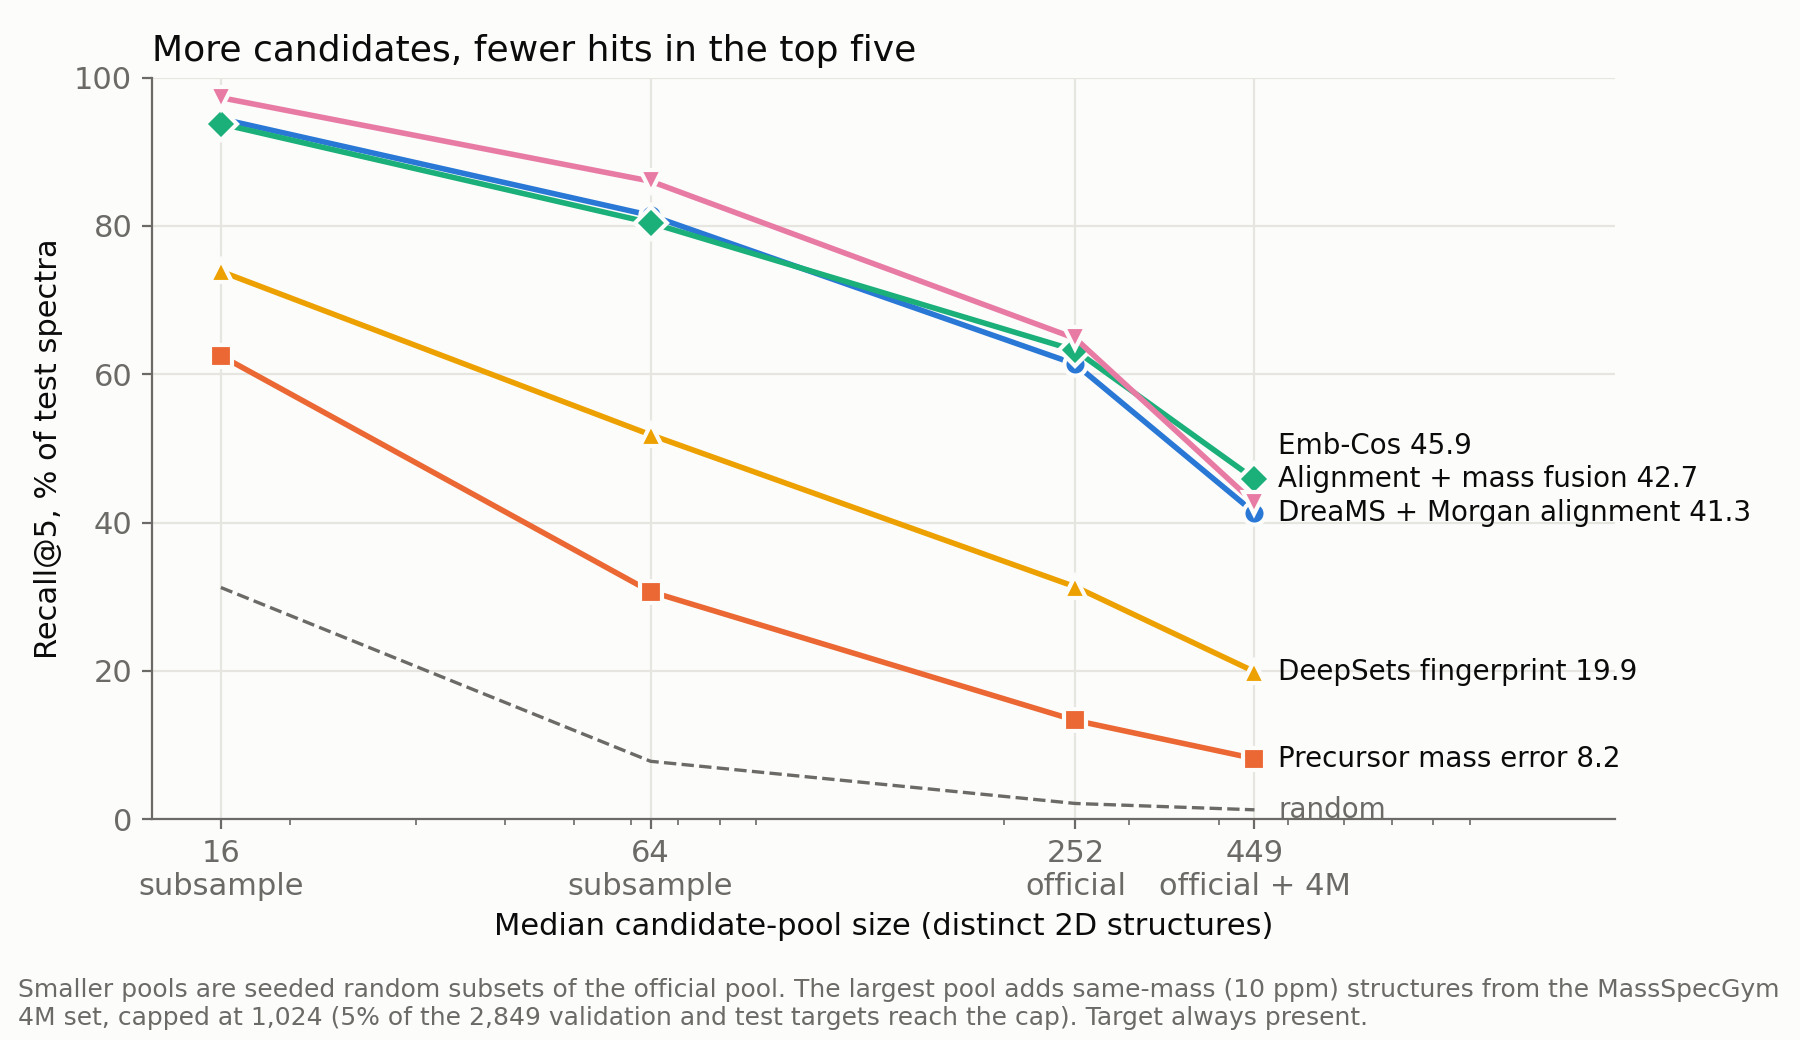
Each method has five places available, even as more structures compete for them. The answer remains in every list. This figure includes the corrected exploratory combined-score results. Corrected analysis.
What if the right molecule is absent?
To test that failure, the study removed the known structure from each candidate list. This was an artificial stress test, not a measurement of how often real searches lack the answer.
They then tried abstention: declining to nominate a shortlist when the highest score was too low. A strict threshold was chosen on separate validation data to limit false nominations to 10%. On the test data, DreaMS + Morgan produced shortlists for only 21.3% of lists that contained the answer, yet still produced them for 13.2% of lists without it. The validation target did not become a guarantee on new data. Recorded abstention results.
That is a difficult trade-off. The strict setting rejected roughly four in five lists that did contain the answer. Relaxing it retained more usable lists but also more false nominations. Neither a high score nor a refusal reliably settles whether the answer is available. Experimental confirmation remains necessary. Interpretation and limitations.
What to take from the comparison
The evidence favours trained alignment models over mass-error ranking for this particular five-candidate task. Keep the candidate-list size and the possibility of a missing answer beside that recommendation. A shortlist helps decide what to investigate; it does not replace identifying a compound against reference evidence.
This was one data split and one training run per model. The uncertainty intervals describe variation across test molecules, not variation across retraining or other datasets. A narrow interval on this split would not, by itself, establish reliability on a different collection of spectra. Some stronger published model combinations were not evaluated, and the benchmark lists were constructed to include the answer. Full limitations.
An October correction recalculated an exploratory combination of alignment and mass scores for the candidates actually available. It reused saved outputs, without retraining; the single-model results above were unchanged. Independent reproduction of the model predictions remains pending. Correction record.
The study and companion are this site’s own project. Their reported scientific review has been automated.
The detailed research version preserves the full tables, scoring rules and results-inspection example. The study repository holds the maintained code and paper. For a related example of evaluating models against a fixed testing budget, see the splicing comparison.
Help improve this article
Found an error or a better source? Leave a note here, or highlight a passage to comment on it.