Your team has been asked whether Evo 2 could help prioritise variants of uncertain significance. Before anyone discusses accuracy, someone has to answer three practical questions. What machine does it need? What will it cost? And if you validate it on one machine, will it give the same answers on the next one?
We ran one Evo 2 container on three kinds of cloud GPU, repeated the whole run four times on fresh machines, ran a precision follow-up on 487 variants to find out why the GPUs disagreed, and then completed a 24 GB NVIDIA L4 follow-up across all 3,893 BRCA1 variants. The short answers:
- A 24 GB or 48 GB GPU fits 8 kb variant scoring; 33 kb or FP32 needs 48 GB. A 24 GB L4 completed all 3,893 BRCA1 variants at 8 kb with 16.8 GiB allocated by PyTorch and 20.8 GiB peak sampled device memory, while 33 kb windows and FP32 runs used about 30 GiB on a 48 GB L40S or 80 GB H100.
- Scoring costs well under a dollar per 1,000 variants at today's list prices when variants share reference windows ($0.45 to $0.80 across H100, L40S, and L4, or about $0.67 to $1.19 per 1,000 variants at two windows each).
- The GPU is part of the method. Two H100s on different clouds gave identical scores. Other GPUs (L40S, L40, L4) did not, because of how low-precision reductions and FP8 calibration round numbers. Running the model at higher precision (FP32) fixes that, at three to six times the cost.
Everything here is reproducible from the study repository, which includes the launch scripts, every result, every failed attempt and the paper.
What Evo 2 does, and what its score means
Evo 2 is a DNA language model from Arc Institute, published in Nature in 2026 (Evo 2 paper). It was trained on more than 8.8 trillion nucleotides across all domains of life (9.3 trillion tokens for the largest model) to predict the next nucleotide given everything before it. It comes in 7B, 20B and 40B parameter versions with context windows up to a million bases (a 1B checkpoint with an 8 kb window also exists, though the Evo 2 paper advises that it "should be avoided owing to overall weaker performance"). The code and weights are open (Evo 2 GitHub).
Because an autoregressive language model predicts the next base given all preceding bases, its training objective gives you a direct zero-shot likelihood score for any single-nucleotide variant or indel without training a classifier on clinical labels:
- Take an 8,192-base window of reference DNA centred on the variant and compute the model's average log-likelihood for the sequence.
- Swap in the alternate allele and compute the log-likelihood again.
- Subtract the reference log-likelihood from the alternate log-likelihood. If a mutation disrupts a conserved coding or splicing motif, the mutated sequence looks less probable to the model, so the log-likelihood drops (and the negated difference rises). Protein language models such as ESM-1b use the same idea at the amino-acid level (Brandes et al. 2023).

Zero-shot likelihood scoring with Evo 2 7B. No classifier is trained, but choosing a cut-off still needs labelled validation data. Diagram by the author.
Two mathematical properties of this score matter when you deploy it:
- It is uncalibrated: it ranks variants relative to one another, but does not output a clinical probability of pathogenicity.
- It is a tiny difference between two large numbers: for a benign variant, the reference and alternate 8,192-base windows differ at only one nucleotide, so their log-likelihoods are nearly identical and the difference sits within roughly of zero. That makes the score surprisingly sensitive to GPU floating-point rounding.
What we ran
One container image, pinned by its digest, ran unchanged on every machine. Each run did five things, all on public data:
| Workload | What it does |
|---|---|
| Correctness test | Arc's own test: the model's loss on four sequences must match Arc's expected value |
| BRCA1 scoring | Scores 3,893 variants, each with 8,192 bases of context, as in Arc's notebook |
| Exon embeddings | Feeds Evo 2's internal representation of 122 genome positions to a small published classifier |
| Memory probe | One pass over 8, 33, 131 and 262 kb of DNA, stopping at the first out-of-memory error |
| Repeat | Rescores 200 variants in a fresh process, to check run-to-run stability |
The BRCA1 labels come from saturation genome editing: Findlay and colleagues edited nearly every possible single-base change in key regions of BRCA1 and measured whether cells still survived, yielding 823 loss-of-function variants and 3,070 functional or intermediate variants across 3,893 single-nucleotide variants (Findlay et al. 2018). The labels are free for nonprofit use.
Choosing a machine
| Provider | Machine | GPU | How to buy it | Tested here |
|---|---|---|---|---|
| Google Cloud | a3-highgpu-1g |
H100 80 GB | Spot or Flex-start only | Yes |
| Runpod | Secure Cloud pod | H100 80 GB | On demand | Yes |
| Runpod | Secure Cloud pod | L40S 48 GB | On demand | Yes |
| Runpod | Secure Cloud pod | L40 48 GB | On demand | Precision follow-up |
| Runpod | Secure Cloud pod | L4 24 GB | On demand | Completed BRCA1 follow-up |
| AWS | p5.4xlarge |
H100 80 GB | On demand | No (launcher included, untested) |
| AWS | g6e.2xlarge |
L40S 48 GB | On demand | No (launcher included, untested) |
Runpod is a GPU-only cloud: you rent a GPU and a container by the second. It runs any container image, which let us use the identical image everywhere, and it publishes ISO 27001 and SOC 2 Type II reports and says it can sign a HIPAA business associate agreement (Runpod compliance).
Only the 7B checkpoints run in standard 16-bit precision across general datacentre GPUs (such as an L4 24 GB, L40S 48 GB or H100 80 GB). The 1B, 20B and 40B checkpoints require 8-bit floating-point (FP8) arithmetic via NVIDIA's Transformer Engine, which demands a Hopper-generation GPU such as the H100 (Arc README, NVIDIA support matrix). Arc reports that the 20B model peaks at 46 GB on one H100 for an 8 kb window (0.7 seconds per sequence) and the 40B model needs two H100s at 95 GB (1.5 seconds per sequence) (Evo 2 release v0.5.0). Allow at least 100 to 200 GB of fast SSD storage: the container image unpacks to roughly 25 GB, and the two 7B checkpoints take 13.8 GB and 13.0 GB. New cloud accounts usually have no GPU quota, so request it first. Our Google Cloud request for one Spot H100 was approved within minutes.
Running it
The repository has a launcher for each provider. Each one creates a machine with a one-off SSH key and a time limit, copies the committed code and inputs, runs the pinned image, copies the results back and deletes the machine whatever happens.
git clone https://github.com/rewire-bio/evo2-cloud-operations
cd evo2-cloud-operations
make test                      # offline: fetch inputs, check hashes, run unit tests

# credentials stay outside the repository
cat ~/.config/evo2ops/env      # GCP_PROJECT=..., RUNPOD_API_KEY=...
set -a; source ~/.config/evo2ops/env; set +a

uv run --frozen python scripts/experiment.py --config configs/full.json \
  --output results/full --platforms P2   # P2 Google Cloud H100, P3 Runpod H100, P5 Runpod L40S
On Google Cloud, the core is one command. The A3 machine type includes its GPU, and --max-run-duration deletes the VM even if your laptop goes to sleep:
gcloud compute instances create evo2-run --zone us-central1-a \
  --machine-type a3-highgpu-1g \
  --provisioning-model SPOT --instance-termination-action DELETE \
  --max-run-duration 3h --maintenance-policy TERMINATE \
  --image-family common-cu129-ubuntu-2204-nvidia-580 \
  --image-project deeplearning-platform-release \
  --boot-disk-size 200GB --boot-disk-type pd-ssd \
  --metadata install-nvidia-driver=True
Google's current Deep Learning VM image cost us six failed attempts. It ships without Docker. It holds the NVIDIA container toolkit at an older version, so the current package will not install beside it. And a background system update can revoke a running container's access to the GPU, so a new process inside it suddenly finds no GPU. The launcher now installs Docker, matches the toolkit version already present, pauses automatic updates during the run, and attaches the GPU through NVIDIA's Container Device Interface (--device nvidia.com/gpu=all) rather than --gpus all (Run log).
On Runpod the pod is the container, so there is no Docker step. One API call creates it:
curl -sS -X POST https://api.runpod.io/v2/pods \
  -H "Authorization: Bearer $RUNPOD_API_KEY" -H "Content-Type: application/json" \
  -d '{"name": "evo2-run",
       "image": "ghcr.io/rewire-bio/evo2-cloud-operations@sha256:22970720...",
       "gpu": {"id": "NVIDIA H100 80GB HBM3", "count": 1},
       "cloud": "SECURE", "disk": 200, "ports": ["22/tcp"],
       "dataCenterIds": ["EU-RO-1"],
       "env": {"PUBLIC_KEY": "ssh-ed25519 ..."}}'
Set dataCenterIds. We did not, and Runpod placed our H100 pod in India in two of four runs. With patient data, that would have been a data-residency breach.
Before any real workload, run the correctness test on the new machine. It takes seconds:
# Arc's expected mean loss for evo2_7b on its four test sequences is 0.3477 (tolerance 0.001)
result = w0_forward_test(model, Path("data/prompts.csv"))
assert result["passed"], result["mean_loss"]
It is a useful smoke test, but as we found later it cannot catch everything.
What it cost and how fast it ran
| Platform | Price per hour (USD) | Windows scored per second | Per 1,000 variants, this test set (USD) | Estimated per 1,000 variants, two windows each (USD) | Billed time | Run cost (USD) |
|---|---|---|---|---|---|---|
| Google Cloud H100, Spot | 6.29 | 2.93 | 0.80 | 1.19 | 46 min | 4.78 |
| Runpod H100, on demand | 4.02 | 2.91 | 0.51 | 0.77 | 42 min | 2.82 |
| Runpod L40S, slower host | 1.12 | 0.61 | 0.68 | 1.01 | 159 min | 2.96 |
| Runpod L40S, faster host (earlier run) | 1.12 | 0.93 | 0.45 | 0.67 | 112 min | 2.09 |
List prices retrieved by API on 9 October 2026, including disk. The BRCA1 set required 5,219 scored windows for 3,893 variants because alternate alleles at the same site share one reference window; the two-window column estimates the cost when every variant requires two separate windows. The first three rows are the recorded run.
The two H100s ran at the same speed on both clouds. Google Cloud's Spot H100 simply cost more per hour than Runpod's on-demand one. Notice how hourly GPU prices mislead: the L40S costs a quarter as much per hour as the Runpod H100 ($1.12 vs. $4.02), but ran three to five times slower—making it the cheapest option per variant on the faster L40S host ($0.45 per 1,000 on this set, or $0.67 at two windows per variant), yet more expensive than the Runpod H100 on the slower host ($0.68 vs. $0.51, or $1.01 vs. $0.77 at two windows). On a GPU cloud you rent a GPU model, not a guaranteed speed, so time a small batch before committing to a large job.
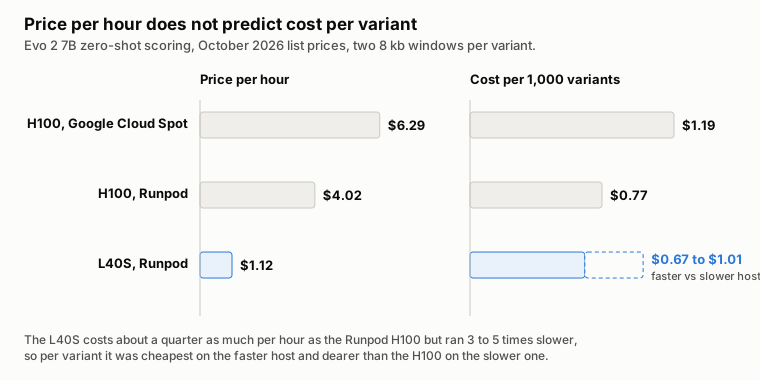
Price per hour against estimated cost per 1,000 variants at two windows each, from the table above. Plotted by the author from measured runs.
For a run this short, setup takes a large share of the bill: pulling the 12 GB compressed container image onto a fresh machine took between 4 and 12 minutes.
A reality check on scale
Scoring the entire BRCA1 dataset (plus verification workloads) on the Runpod H100 cost $2.82 including container download, or about $2.00 for the variant scoring itself. For a targeted gene panel or a shortlist of variants of uncertain significance, that is pennies. Scaling up without filtering is another story:
- One patient's whole genome carries 4.1 to 5.0 million variants relative to the reference genome (depending on ancestry across the 1000 Genomes Project's 2,504 individuals; 1000 Genomes Project 2015). Scoring every variant in a single genome with Evo 2 7B would cost $3,150 to $3,850 at the Runpod H100 two-window rate.
- All of ClinVar: Extracting embeddings across ClinVar—which took EVEE roughly 20,000 H100 GPU-hours (Pearce et al. 2026)—would cost about $80,000 at the same Runpod H100 rate.
Filter your candidate variants with fast, free annotations first; run a 7B foundation model only on the variants that still need adjudication.
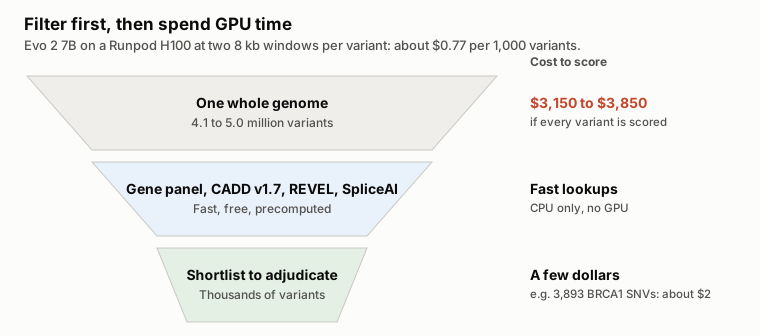
Evo 2 7B scoring cost before and after filtering with precomputed annotations, at the Runpod H100 two-window rate. The BRCA1 figure is the measured cost of scoring that set, where variants at the same site shared reference windows. Diagram by the author.
Evo 2 7B on a 24 GB L4: Completed Follow-up
On 16 October, a 24 GB NVIDIA L4 completed the same 3,893 BRCA1 variants at 8,192 bp and batch size one. The pinned model passed its reference forward test before scoring (measurements, scores and provenance).
| Measure | L4 result |
|---|---|
| Variants scored | 3,893 of 3,893 |
| Window evaluations | 5,219, including 1,326 shared reference windows |
| Scoring time | 4 hours 55 minutes 4 seconds |
| Mean time per window | 3.39 seconds |
| Peak PyTorch allocated memory | 16.8 GiB |
| Peak sampled total device memory | 20.8 GiB |
| Scoring cost per 1,000 variants, compute only | $0.75 |
| Scoring cost per 1,000 variants, including disk | $0.76 |
| This L4 allocation, from setup through deletion | $3.02 estimated |
The completed L4 follow-up at 8,192 bp and batch size one. These measurements use the scoring and allocation boundaries described below.
The price was $0.59 per GPU-hour, plus a 100 GB container disk: about $0.604 per hour together. The per-variant figures cover the scoring interval, including incremental result writes, and benefit from shared reference windows. The $3.02 allocation estimate also includes startup, weight download, export and deletion; earlier failed allocations are separate. These are estimates from the recorded rate and elapsed time, not settled invoices. Timing boundaries and window order differ from the earlier study, so these rows do not establish a controlled GPU speed comparison.
The L4 fit this 8 kb workload with sampled device use (20.8 GiB) below its 24 GB capacity. The 16.8 GiB PyTorch figure alone would understate total memory use. Longer inputs, larger batches and embedding extraction need separate measurements.
How much memory it needs
Peak allocated GPU memory for a single forward pass was 16.8 GiB at 8 kb (with 20.8 GiB total sampled device memory on the 24 GB L4) and 30.3 to 30.4 GiB at 33 kb (32,768 bp) on the 48 GB L40S and 80 GB H100, and ran out of memory at 131 kb on both the 48 GB L40S and the 80 GB H100 (where the run would have needed more than 84 GiB against 79.2 GiB of usable H100 memory). We did not test lengths between 33 kb and 131 kb; extrapolating linearly, about 65 kb might fit on one 80 GB H100 but not on a 48 GB L40S.
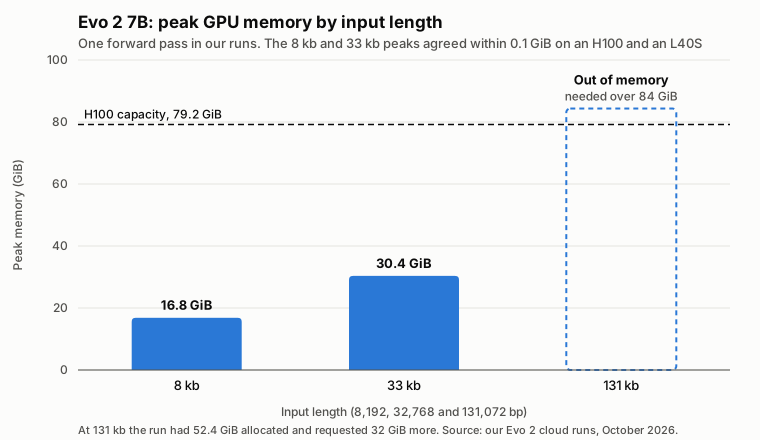
Peak GPU memory allocated by Evo 2 7B for a single forward pass across increasing DNA window lengths, measured across the cloud GPU runs.
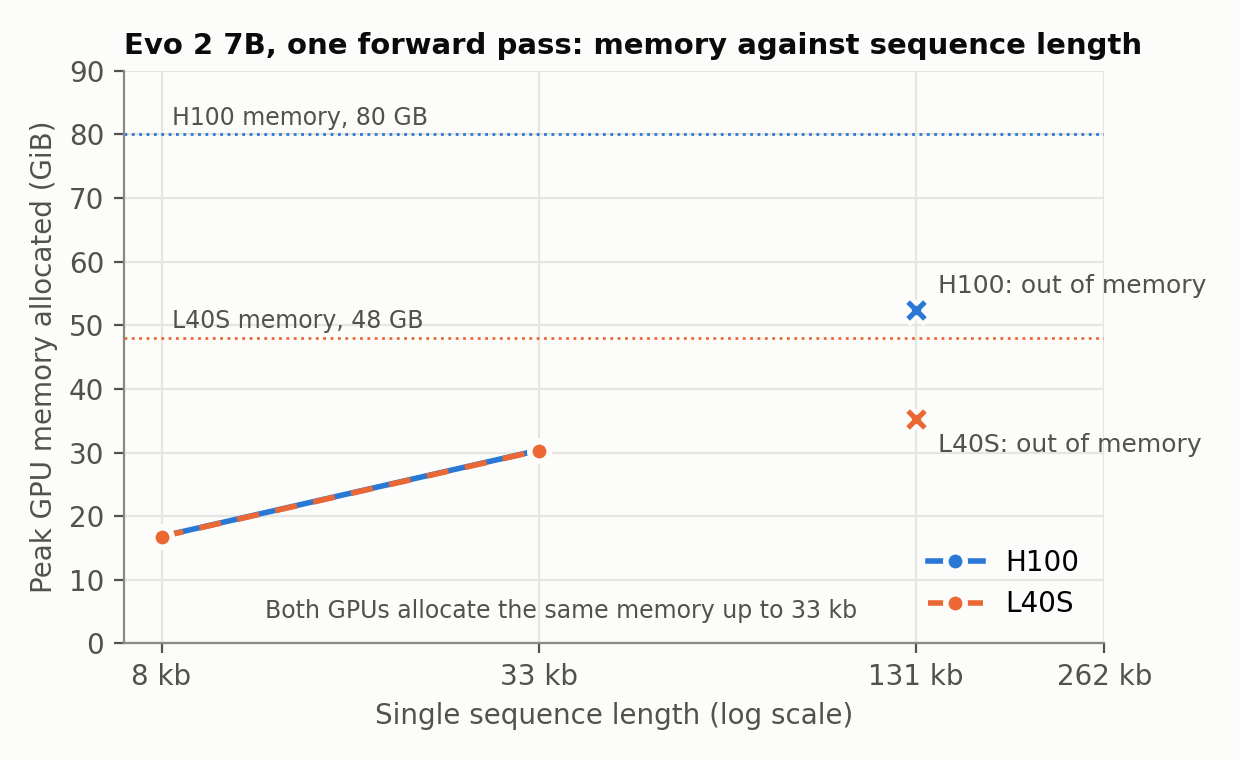
Both GPUs used the same memory until they ran out. Crosses mark the memory in use when the next allocation failed.
So with Arc's standard single-GPU inference code, the advertised million-base context is a property of the model rather than of a single GPU. Arc's maintainers point users to multi-GPU sequence-parallel frameworks such as BioNeMo for long sequences (Arc issue 160).
The GPU changes the answer
Every machine reproduced its own scores exactly when rerun, and each platform gave bit-identical scores across four separate runs on fresh machines in different data centres. The Google Cloud H100 and the Runpod H100 matched each other exactly too, on every variant. The L40S did not.
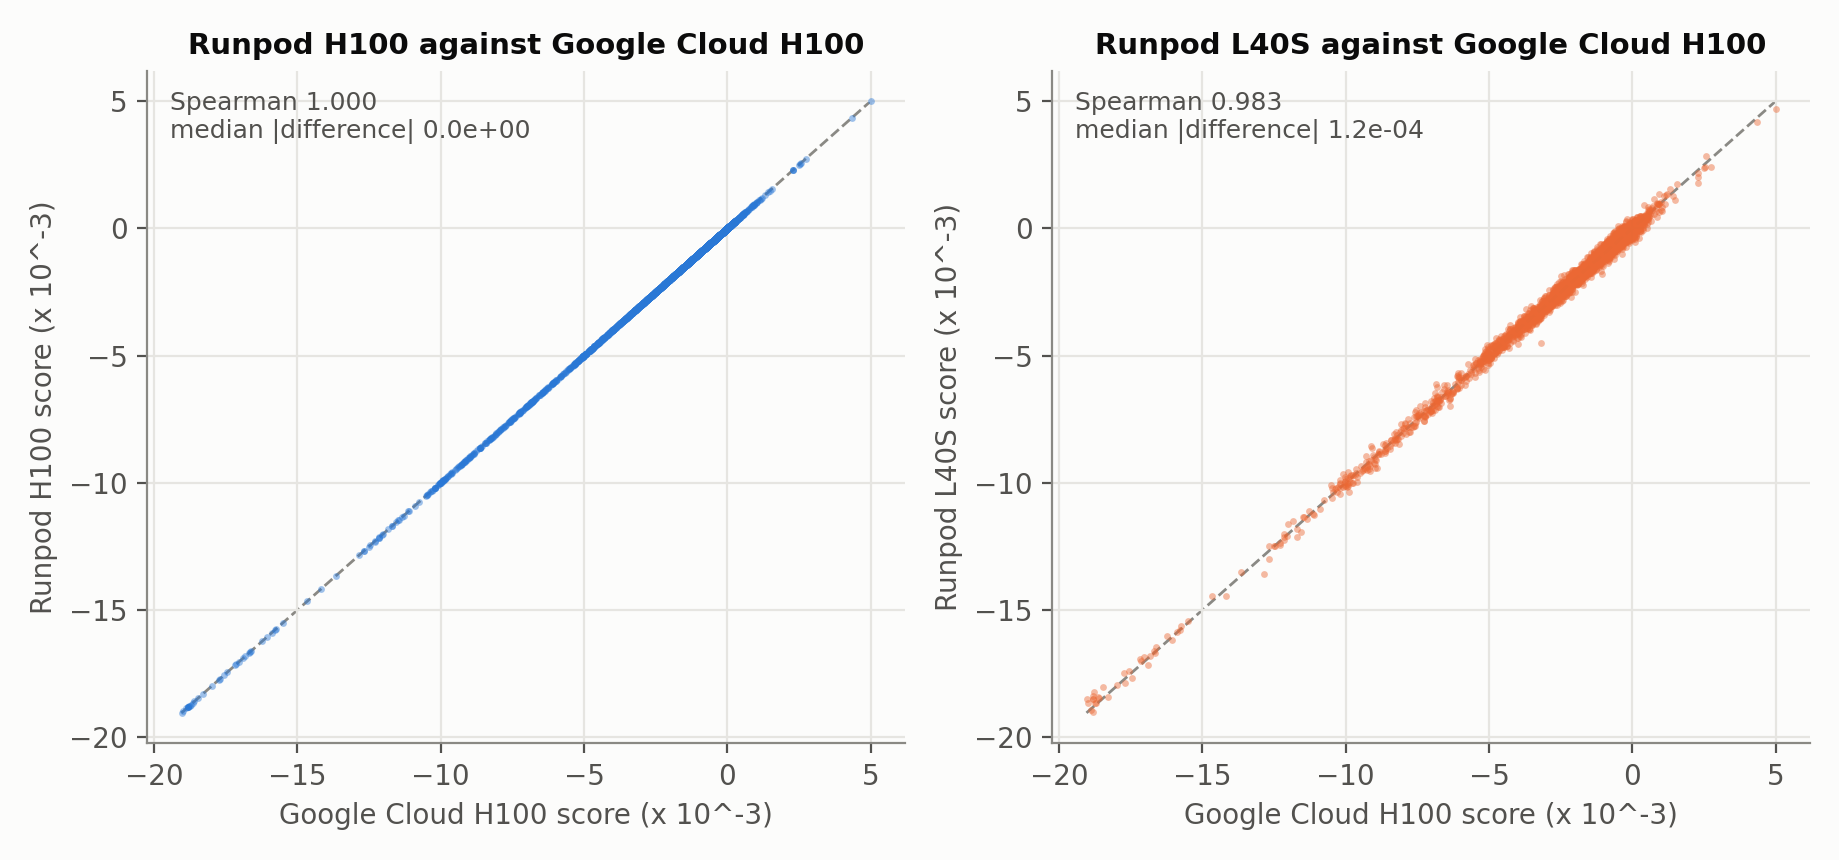
Left: two H100s on different clouds, identical. Right: an L40S against the H100. Same image, code and inputs.
The typical difference between the L40S and the H100 was per variant. That sounds negligible until you remember that the score is a difference between two nearly equal likelihoods: most harmless variants score within a few of zero. A shift of that size is enough to reorder them. Across all 3,893 variants, 2,627 moved by more than 1% of the list, and some small scores changed sign. Overall discrimination of loss-of-function variants barely moved (AUROC 0.877 on the L40S against 0.875 on the H100), and the variants that matter most were steadier: 48 of the 50 that each GPU scored as most damaging were the same.
A lab would not use ranks, though. It would pick a threshold and call every variant above it. So we fixed thresholds on the H100 scores and applied them unchanged to the L40S. At the threshold that best balances sensitivity and specificity (Youden's index), 72 of the 3,893 variants (1.8%) changed call. At thresholds set for 90% and 95% sensitivity to loss-of-function variants, 152 (3.9%) and 189 (4.9%) changed. The changes went both ways in similar numbers, and they were borderline variants: half sat within of the threshold on the H100. A binary call hides that, so the same variant could be reported differently depending on which GPU scored it (Classification flips).
Users had reported this in Arc's issue tracker without an answer (Arc issue 178). Arc's correctness test does not catch it either; the L40S passed it.
L4 Score Agreement: The Predefined Criterion Was Not Met
The L4 follow-up used the same 3,893 variants and pinned checkpoint as the historical H100 reference. Its AUROC was 0.8772, against 0.8750 for H100. We checked agreement against limits defined before the run:
| Agreement measure | Result | Predefined requirement |
|---|---|---|
| Absolute AUROC difference | 0.00223 | At most 0.01: met |
| Spearman score-rank correlation | 0.9829 | At least 0.99: not met |
L4 score agreement against the pinned historical H100 reference. Both numerical requirements had to pass.
Complete variant coverage and a passing forward test were also required; both were achieved. The combined agreement criterion was not met because rank correlation fell below 0.99. Similar AUROC does not mean identical variant rankings; this also does not show that L4 was less accurate, since its observed assay AUROC was slightly higher.
This comparison does not isolate the GPU as the cause. The historical H100 workflow scored all unique reference windows before the alternate windows; the L4 workflow interleaved each unseen reference with its alternate. Window order can affect calibration of the 8-bit (FP8) input projections, but we have not established its contribution to the observed differences. The downloadable offline analysis bundle includes both score files, assay labels and a dependency-free script that recomputes the AUROCs and rank correlation without model inference. See its instructions and data terms.
The local monitoring process failed during the run, but the same GPU process continued to completion. Its final results were recovered and independently checked, and the pod was deleted. This is a completed recovered run. The wider CPU and model-size comparisons remain incomplete; a clean full-study reproduction was not performed.
Why GPUs disagree
Computers store numbers with a fixed number of binary digits, so most arithmetic is rounded. One consequence surprises people: the order in which you add numbers changes the result, because each partial sum is rounded before the next number is added (Goldberg 1991). A neural network is mostly enormous sums, and a GPU splits each sum across thousands of parallel threads. The software libraries that do this choose how to split the work separately for each GPU, so different GPUs add the same numbers in a different order and round differently.
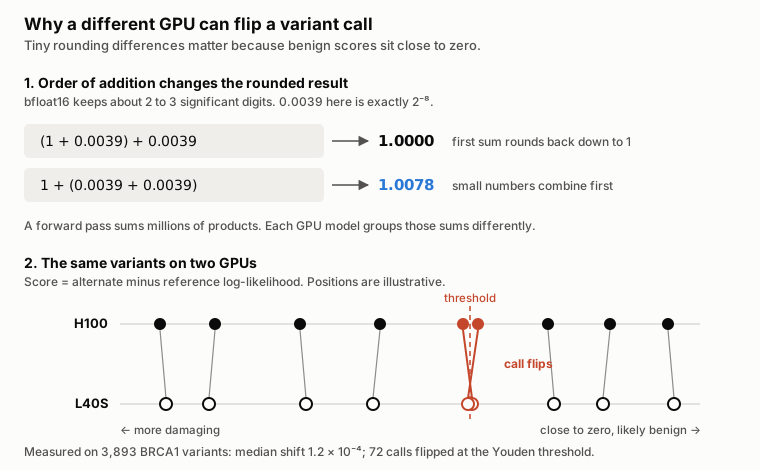
Top: a real bfloat16 example of addition order changing a rounded sum. Bottom: how a small cross-GPU score shift moves variants near a threshold to the other side. Dot positions are illustrative; the measured values are from the cloud runs. Diagram by the author.
How much this matters depends on precision. Evo 2 runs mostly in bfloat16, a 16-bit format that keeps only two to three significant decimal digits, and when NVIDIA's Transformer Engine is installed, as in Arc's own container, some layers use 8-bit FP8 arithmetic (FP8 formats). Low precision makes models fast and cheap, but it means each rounding step is coarse.
Large language model researchers have measured the same effect. Running identical models in bfloat16 on an A100, an L40S and an H100, Cooper and colleagues found that outputs diverged on most test problems across GPUs, while each GPU was stable on its own (Cooper et al. 2026). Yuan and colleagues showed that moving from bfloat16 to FP32 removed most of this variation in reasoning models (Yuan et al. 2025). A separate source of variation, batch size, affects inference servers that group requests together (He 2025). PyTorch itself does not promise identical results across different hardware (PyTorch reproducibility notes).
We had not seen this measured for a genomic model, so we ran a follow-up on 487 of the BRCA1 variants. We scored them on an H100, an L40S and an L40 under three settings: the default, with FP8 turned off, and with the whole model in 32-bit FP32 arithmetic (TF32 disabled and standard attention). Each GPU's default run first reproduced its earlier scores exactly.
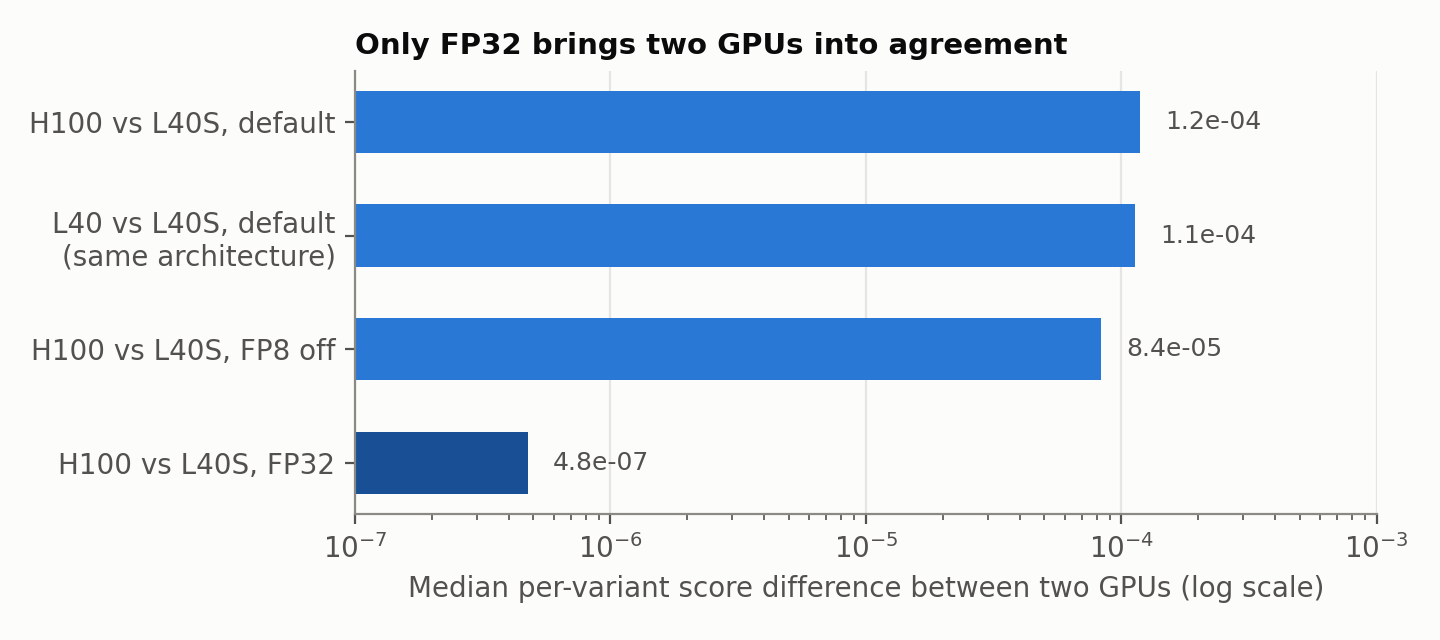
Median per-variant score difference between two GPUs, 487 BRCA1 variants. Lower is better agreement.
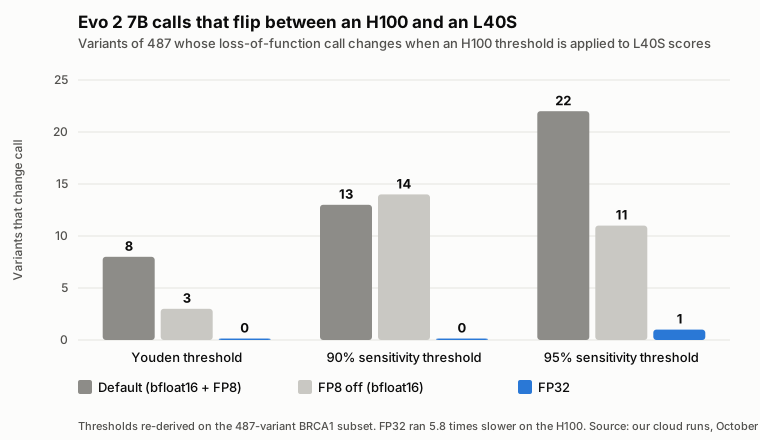
Loss-of-function calls that change when a threshold set on H100 scores is applied to L40S scores, for 487 BRCA1 variants at three thresholds. Turning FP8 off does not fix the drift consistently; FP32 does. Measured in our cloud GPU runs (Classification flips).
Four results came out of it:
- FP32 fixes it. In FP32 the H100 and L40S agreed to a median of , about 250 times closer than by default, with identical rankings. The largest difference on any variant was . At the same three kinds of threshold, 0, 0 and 1 of the 487 variants changed call, against 8, 13 and 22 in the default precision.
- FP8 is only part of the story. Turning FP8 off narrowed the gap by about 30%. The remaining 70% comes from rounding in 16-bit bfloat16.
- Same architecture is not enough. An L40 and an L40S use the same Ada Lovelace chip architecture, yet they disagreed as much as an H100 and an L40S. The libraries tune their reduction kernels to each specific product, so validation has to be per GPU product, not per GPU generation.
- Batching is safe. Scoring 8 kb windows in batches of 8 gave scores bit-identical to scoring them one at a time.
There is a quieter lesson too. On a single GPU, switching from the default precision to FP32 changed scores by about , the same size as the difference between GPUs. So the default scores carry rounding error of that size whichever GPU computes them. The FP32 score is the closest to what the model actually says.
FP32 is not free. It was 5.8 times slower on the H100 and 3.4 times slower on the L40S, and used about 30 GiB of memory, which still fits on a 48 GB GPU. That raises the cost of scoring from about USD 0.50 to about USD 1.50 to 3 per 1,000 variants (Follow-up results).
Does it separate damaging variants?
For context, here is how the zero-shot scores compared with familiar baselines taken from the same BRCA1 table.
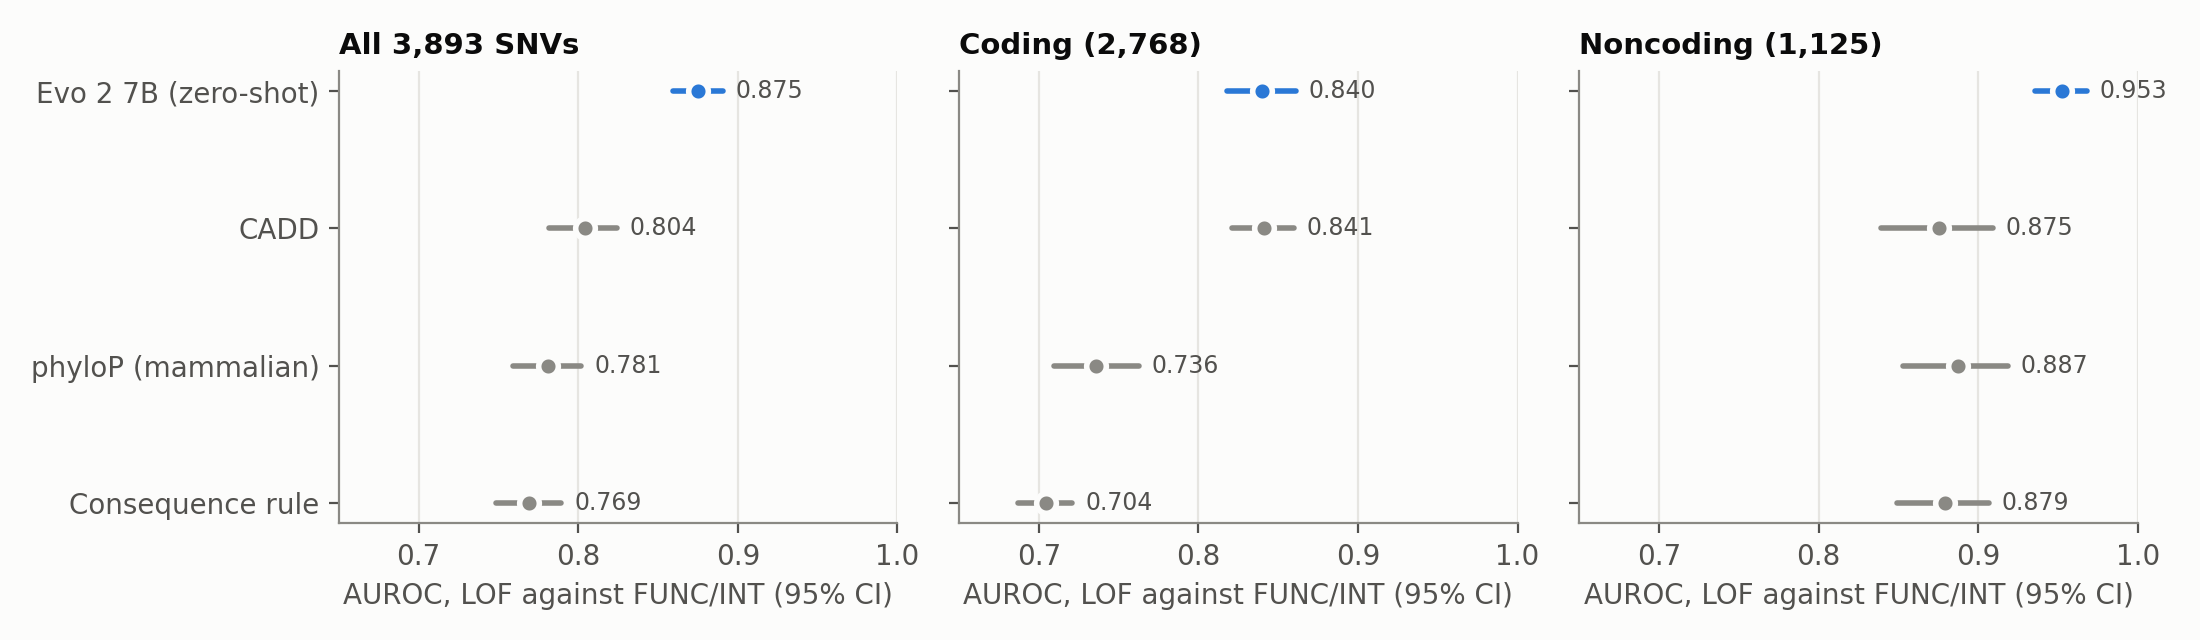
AUROC for separating loss-of-function from functional variants, with 95% intervals from resampling positions. CADD is version 1.3, from the 2018 BRCA1 table.
Evo 2 7B reached an AUROC of 0.875 overall, against 0.804 for 2015 CADD v1.3. The advantage was concentrated in noncoding variants (0.953 against 0.875, a difference); on coding variants no difference was detected (0.840 and 0.841). That matches the Evo 2 paper, which reports its strongest results on noncoding and splice variants and weaker ones on coding variants, where protein-level tools such as AlphaMissense and ESM-1b lead (Evo 2 paper).
The CADD scores bundled with the BRCA1 dataset in 2018 are version 1.3. Later versions of CADD added modern splicing predictors aimed at the exact noncoding and splice-region variants where Evo 2 led (Rentzsch et al. 2021, Schubach et al. 2024). So we matched those exact variants against current precomputed scores from CADD v1.7 (Schubach et al. 2024), SpliceAI (Jaganathan et al. 2019), and (for the 2,086 missense variants) REVEL v1.3 (Ioannidis et al. 2016):
| Variant subset | Count | Evo 2 7B | CADD v1.3 | CADD v1.7 | SpliceAI | REVEL |
|---|---|---|---|---|---|---|
| All | 3,893 | 0.875 | 0.804 | 0.881 | 0.694 | — |
| Coding | 2,768 | 0.840 | 0.841 | 0.892 | 0.588 | — |
| Noncoding | 1,125 | 0.953 | 0.875 | 0.932 | 0.963 | — |
| Missense, within coding | 2,086 | 0.785 | 0.738 | 0.828 | — | 0.867 |
AUROC for ranking experimentally defined loss-of-function BRCA1 variants across the exact same variants within each row, using the original H100 Evo 2 predictions (the L4 follow-up reached 0.8772 overall and is reported above). CADD uses its raw score; SpliceAI uses the largest of its four masked delta scores, retrieved from the CADD annotations; REVEL uses the maximum score across transcripts (Scores, coverage and methods).
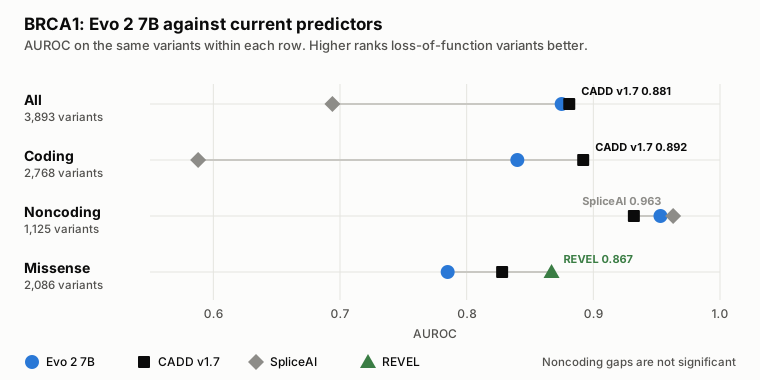
AUROC by variant subset as a dot plot. Current CADD v1.7 or REVEL lead on all, coding and missense variants; SpliceAI leads on noncoding variants, where the gaps to Evo 2 7B are not statistically significant. Plotted by the author.
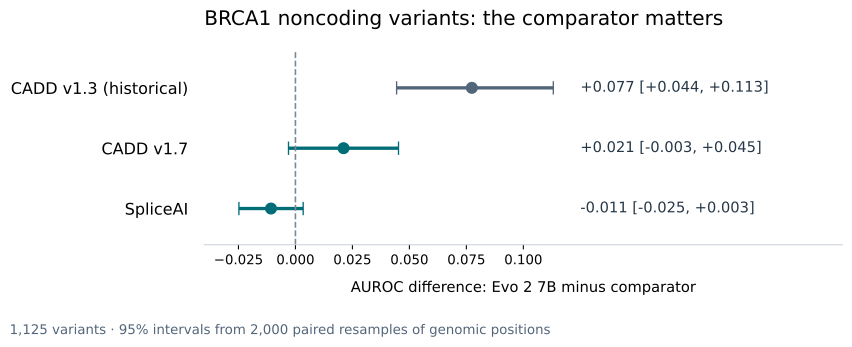
Paired AUROC differences on 1,125 noncoding BRCA1 variants: Evo 2 7B clearly beats the older CADD v1.3 baseline (+0.077), but its differences against current CADD v1.7 and SpliceAI both cross zero. Points and 95% bootstrap confidence intervals (2,000 resamples grouped by genomic position) are from our completed analysis; positive values favour Evo 2.
Once you update the baseline to current CADD v1.7 or SpliceAI, the noncoding advantage disappears: Evo 2's paired difference is against CADD v1.7 (95% confidence interval: to ) and against SpliceAI (95% interval: to ). Because both intervals cross zero, this test detected no statistically significant difference on noncoding variants (which is not proof of equivalence)—while on coding and missense variants, CADD v1.7 (0.892) and REVEL (0.867) clearly beat zero-shot Evo 2 7B. Note also the biological scope: 230 of the 239 noncoding loss-of-function variants in this BRCA1 assay sit in canonical splice sites or splice regions, REVEL's training set may overlap BRCA1, and cellular survival in saturation genome editing is an experimental proxy rather than a clinical diagnosis (Current predictors). What holds up is that a zero-shot model with no splicing or protein features matches the best noncoding predictor without training on clinical labels.
You can verify every number in the BRCA1 table on a laptop in two minutes without a GPU. Download the companion reproduction script, install uv and tabix from HTSlib, review the non-commercial data terms for the assay labels and CADD scores, and run:
uv run --script reproduce_brca1.py --fetch
A clean run on 15 October verified all SHA-256 hashes, coordinate matches, AUROCs, and position-grouped bootstrap intervals.
Controls for a clinical setting
- Keep patient data off hosted APIs. NVIDIA's hosted Evo 2 API terms prohibit protected health information and production use (NVIDIA API Trial Terms). Self-host in an account covered by a business associate agreement: AWS lists EC2 and EBS as HIPAA-eligible, and Google's BAA covers Compute Engine (AWS, Google Cloud).
- Pin the location. Set the region or data centre explicitly on every provider.
- Pin everything else. Reference the container by digest, the weights by Hugging Face revision and the inputs by checksum.
- Decide how much numerical stability you need. If scores must agree across hardware, run in FP32 and budget three to six times the compute. If not, fix the exact GPU product and validate on it. Either way, keep a reference panel of variants with stored scores and check every new machine against it, and treat variants within about of a decision threshold as borderline.
- Check weight hashes before loading. Arc's loader uses Python's pickle format, which can run code when a file is opened. The study's loader refuses any checkpoint whose SHA-256 does not match.
- Avoid remote code. Arc's exon notebook loads its classifier with
trust_remote_code. The classifier is a two-layer network, so we rebuilt it locally and loaded only its weights. - Set a hard time limit. On Google Cloud,
--max-run-durationdeletes the VM whatever happens to the laptop that started it. On Runpod there is no equivalent setting, so check for leftover pods after every run. - Do not tie long jobs to your SSH session. One of our runs died when a laptop's connection dropped. Run long jobs detached (
nohup,tmuxor a background container) and poll for completion.
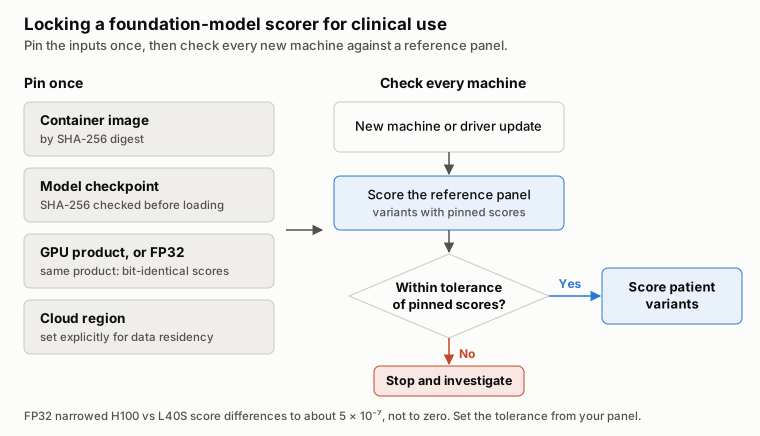
A pin-and-check routine for running a foundation-model scorer in a regulated pipeline, based on the setup traps and cross-GPU drift measured in our cloud runs. Diagram by the author.
Where Evo 2 operations are heading
- Packaged deployment is converging on NVIDIA NIM. Evo 2 ships as a NIM container and through AWS SageMaker, where the recommended real-time instance for 7B is an L40S. That reduces installation work but adds a vendor licence and a less inspectable runtime (NIM container, AWS Marketplace).
- Long context means multi-GPU. Windows much beyond about 33 kb per pass need frameworks that split a sequence across GPUs, which are harder to install and reproduce.
- Embedding pipelines are more accurate and much more expensive. A 2026 preprint trained classifiers on Evo 2's internal representations and beat likelihood scoring on ClinVar, but extracting them with 65 kb windows for 4.25 million variants took about 20,000 H100-hours and 34 TB of storage (EVEE preprint).
- Numerical reproducibility is getting tools. Kernels that fix the order of summation can make results bitwise identical across GPU generations, at some cost in speed (Cooper et al. 2026). For now, FP32 is the practical option for Evo 2.
- New GPUs need checking. A user reports wrong losses for the 1B checkpoint on a Blackwell GPU (Arc issue 157).
Limitations
These are a handful of runs on three cloud platforms and three GPU products, so the timings are receipts rather than benchmarks, and prices change. AWS was not run; its launcher is in the repository but untested, and an AWS run can follow when we have an account. Only the 7B checkpoints were tested. The FP32 follow-up used a subset of 487 variants. The decision thresholds were set on the same BRCA1 scores they were tested on, so they show how often calls change, not what a validated threshold would be. REVEL was trained on labelled missense variants that may include BRCA1, so its missense result may be optimistic. The BRCA1 comparison covers one gene from one assay, uses CADD v1.3 in its initial figure before comparing against CADD v1.7, SpliceAI and REVEL, and says nothing about calibration or performance across ancestries. An independent methods review found reporting errors in our first write-up of the paper, which we corrected; its report and our response are in the repository.
For the wider clinical review of genomic foundation models across diagnostic tasks, see Genomic Foundation Models in the Diagnostic Lab and Genomic Foundation Models in 2026.
Help improve this article
Found an error or a better source? Leave a note here, or highlight a passage to comment on it.